Data-driven Infographics, Visualisations & Dashboards
THINGS WE Do
Data-driven Infographics
Looking to convey a message in a graphical way that includes the use of data? Our solutions are aimed at getting the attention of your target audience and providing them the desired understanding effectively and without ambiguity. And if you want an existing data-driven infographic reviewed, we can do that too…FREE!
Send it to review@colourmynumbers.au
Data Visualisations
Creating a presentation that needs to include visual representations of data? While you focus on the rest of the presentation, we will produce the visualisations that help you deliver the story you want told.
Dashboards
Need to have your raw data shown as meaningful information on a regular basis to make operational decisions and assessments? We will assist you and your team to define what needs to be displayed, in what way, and with what interactivity, ahead of creating a product that your team will want to use on an ongoing basis.
Tableau
If your own instance of Tableau Cloud isn’t possible, we can publish to ours, applying the required security to restrict accessibility.
Already a Tableau client but need to supplement your team with an experienced developer? We can provide a remote or hybrid service – get in touch to check our availability and discuss mutually beneficial working arrangements.
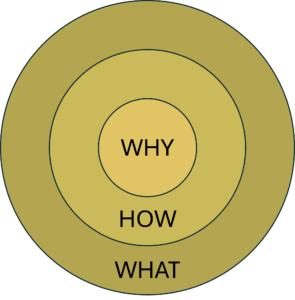
OUR "GOLDEN CIRCLE"

We believe in influencing decisions and inspiring actions that benefit our clients, their families, their teams and their communities. This is achieved by our utilisation of industry leading technologies to create impactful, innovative, accurate and high quality data-driven designs, productions and solutions.
WHAT We VALUE
Quality
of our deliverables
We aim to excel in all that we do and produce
Accuracy
of our data representations
We believe mis-information is worse than no information
Creativity
in our designs
We prefer to try and fail rather than not try at all
Beneficial Outcomes
from our service
We want our clients to realise the benefits they seek from engaging us
Continuous Learning
in our techniques
We learn, improve, embed and share knowledge & expertise to get the best of the technologies we utilise
The Team

Rob Negerman – Founder
Rob established Colour My Numbers following a very successful corporate career delivering highly regarded data visuals and dashboards, working exclusively in Tableau from 2016.
He understands the information needs of small & medium enterprises (SMEs) having co-owned/co-directed cafés, operated as a business coach under a franchise model, and employed to create managerial reports as a management & systems accountant.
The use of colour is also a key in his personal time, with his main hobby being coloured pencil art.

Mallee – Wellbeing Specialist
The wellbeing of our team is important, and Mallee ensures that we spend time away from the screen by leading us on nature walks.
Associates
For solutions requiring specialist skills not covered by our internal team, we engage individuals and businesses from our professional network to either provide guidance or contribute directly.
CLIENT STATEMENTs
The following relate to Rob’s employment engagements:
“It has been a pleasure working with you, you are great at what you do, including understanding my ramblings and turning it into a high quality product!”
Matt S, BHP, Feb 2024
“A big thankyou for delivering such a great visual dashboard and a key tool to enable {us} to improve the way we work.”
Donna S, OZ Minerals, Jan 2023
GET IN TOUCH
Location:
- Operating from Kangarilla, SA
Email:
- Solution requests, reviews, quotes & support:
review@colourmynumbers.au
- Administration:
rob@colourmynumbers.au
Phone:
- Rob – 0433 491 316
